Is BMI Obsolete? Understanding Body Mass Index vs. True Body Composition
The 19th-century origin of the Quetelet Index, why ordinary scale weight deceives athletes, and how measuring body fat percentage, lean mass, and waist-to-height ratio gives a complete picture of health.
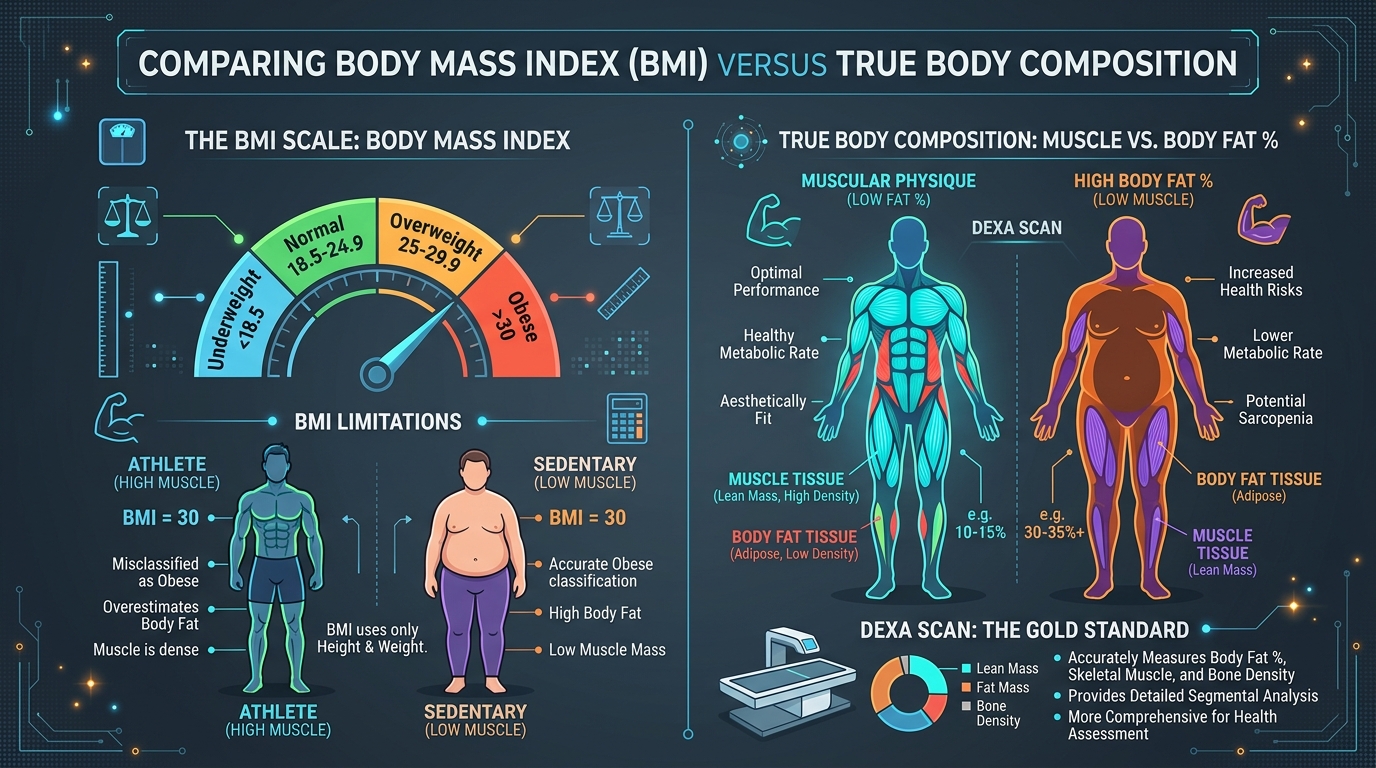
Visualizing the critical differences between gross weight on a scale (BMI) versus lean muscle mass, adipose tissue, and visceral fat distribution.
Step into almost any routine doctor's appointment or wellness checkup today, and you will encounter the same ritual: you step on a scale, stand under a stadiometer to measure your height, and an algorithm calculates a single two-digit number: your Body Mass Index (BMI).
If that number falls between 18.5 and 24.9, you are pronounced "Normal Weight." If it creeps above 25.0, you are categorized as "Overweight." If it passes 30.0, you are labeled "Obese."
Yet, according to this very same metric, prime-condition NFL running backs, Olympic sprinters, and world-class bodybuilders are routinely classified as clinically obese. Meanwhile, sedentary individuals with dangerously high levels of hidden visceral fat around their vital organs are frequently told their health is "perfect."
How did a simple ratio created in the 1830s become the gold standard of modern health assessment—and what should you measure instead?
1The Surprising History of BMI: Born for Astronomy, Not Medicine
The Body Mass Index was not invented by a physician, nutritionist, or physiologist. It was created in the 1830s by Adolphe Quetelet, a Belgian mathematician, astronomer, and statistician.
Quetelet was fascinated by social physics and sought to calculate the statistical characteristics of "l'homme moyen" (the average man) to help European governments allocate societal resources and track population-level statistics.
The Classical Quetelet Formula:
BMI = weight (kg) ÷ [height (m)]²
Quetelet himself explicitly warned that this ratio was designed solely to analyze broad population cohorts across census data—never to diagnose the individual health or body composition of a single human being.
2The 3 Fatal Blindspots of Body Mass Index
It Cannot Distinguish Muscle from Fat
Muscle tissue is approximately 18% denser than adipose (fat) tissue and carries significant water and glycogen. Because BMI only measures total mass on a scale, a muscular athlete weighing 90 kg at 10% body fat gets the exact same BMI score as an inactive individual weighing 90 kg at 35% body fat.
The "Skinny-Fat" (TOFI) Deception
Medical researchers use the term TOFI (Thin Outside, Fat Inside) or "normal weight obesity." A person may have a low scale weight and a "healthy" BMI of 21, but have very little skeletal muscle and dangerous amounts of deep visceral fat wrapping around their liver, pancreas, and heart.
Age-Related Sarcopenia
As humans age past 40, they naturally lose 3% to 8% of their skeletal muscle mass per decade unless actively strength training. If an older adult loses 5 kg of muscle and gains 5 kg of fat, their scale weight and BMI remain completely unchanged, masking a severe decline in metabolic health and bone density.
3True Body Composition: The Numbers That Actually Matter
To understand your metabolic fitness, longevity, and physical vitality, modern sports science looks at True Body Composition:
The proportion of your total body weight composed of adipose tissue. Healthy ranges for men typically range from 10% to 20%, and for women from 18% to 28%.
Everything in your body that is not fat: skeletal muscle, bones, vital organs, and water. Lean mass is your primary metabolic engine—it determines your Basal Metabolic Rate (BMR) and daily glucose clearance.
Subcutaneous fat sits just beneath the skin (pinchable fat). Visceral fat is hormonally active fat stored deep within the abdominal cavity, strongly linked to insulin resistance, type 2 diabetes, and cardiovascular risk.
A simple, highly accurate biomarker: your waist circumference should measure less than half your height (WHtR < 0.50). This single metric outperforms BMI in predicting cardiovascular mortality across multi-decade studies.
4How to Accurately Measure Body Composition
| Method | Accuracy | Cost & Accessibility | Key Strengths & Weaknesses |
|---|---|---|---|
| DEXA Scan 🌟 | Gold Standard (±1-2%) | $75 - $150 / scan | Measures regional fat distribution, bone density, and precise lean mass. |
| Hydrostatic (Underwater) | Very High (±2-3%) | Specialized lab clinics | Measures water displacement. Uncomfortable for some; hard to access. |
| US Navy Tape Method | Good (±3-4%) | Free (Measuring tape) | Uses neck, waist, and hip circumferences. Great accessible tracking tool. |
| Bioimpedance (Smart Scales) | Variable (±5-8%) | $30 - $100 home scale | Highly sensitive to hydration levels and meal timing; best for trend lines only. |
5The Holistic Approach: How to Connect BMI with BMR & TDEE
Does this mean you should completely ignore BMI? Not necessarily.
BMI remains a useful first-glance epidemiological baseline for general populations who are not heavily strength-trained. However, you should never make fitness, nutritional, or health decisions based on BMI alone.
Instead, combine your scale measurements with:
- Waist-to-Height Ratio: Confirm your waist is under half your height.
- Basal Metabolic Rate (BMR): Understand how many calories your organs and lean mass burn at complete rest.
- Total Daily Energy Expenditure (TDEE): Calculate your actual calorie maintenance level based on your activity coefficient.
- Progressive Strength & Biomarkers: Track blood pressure, fasting glucose, lipid panels, and physical stamina.
6Calculate Your Metrics with DayLogic Fitness Tools
DayLogic provides scientifically backed, privacy-first health tools in our Fitness & Health Suite.
Calculate your exact BMR (Mifflin-St Jeor), estimate your TDEE, set customized macronutrient splits, and analyze your daily energy balance—all computed securely and instantly in your browser with zero data stored.
Optimize Your Fitness & Nutrition
Calculate your BMR, TDEE, macro ratios, and calorie targets with DayLogic Fitness Tools.